Geolocation EPMV. How do I see EPMV differently in different countries? What are the best EPMVs for each country?
- What is EPMV?
- Earnings / per minute
- Why EPMV?
- Big data analytics and statistics by country
- Average online ads earnings by country: interactive map
- USA average display advertisement EPMV
- Average online ads earnings by US State: interactive map
- Germany average display advertisement EPMV
- Russia average display advertisement EPMV
- Top 10 Countries with the Most Traffic
- Top 10 countries by page views
- Top 10 countries in terms of pageview engagement
- Top 10 countries by average time of page visits
- Top 10 countries with the highest bounce rate
- Top 10 countries for the largest EPMV
- Top 10 Countries by Least EPMV
- Big data analytics from Ezoic
- Interactive table of average EPMV by country
- Frequently Asked Questions
What is EPMV?
EPMV - This term stands for profit per visitor. This is the amount that the site owner earns for every thousand visits to his website. EPMV can be calculated as follows: EPMV = Total Revenue / (Visitors / 1000). For example:
- In March, the site earned $ 1,000 (AdSense) + $ 5,000 (ADX) + $ 500 (native ads) = $ 6,500.
- The March sessions - from Google Analytics - were attended by 1,000,000 people.
- EPMV was $ 6,500 / (1,000,000 / 1,000) = $ 6.50 EPMV.
The income a website receives is influenced by many factors, such as the number of visits, the number of ads shown during each user session, the bounce rate of each landing page, the pages viewed per visit, the source of upstream traffic, the time of day. , ad type (display, native, embedded), RTB bids, ad parameters, viewport size, user's connection speed, and many other important parameters.
Regardless, many publishers are very focused on RPM - it's page revenue per 1000 page views. RPM is also known as effective cost per thousand impressions - effective cost per thousand impressions per page.
Earnings / per minute
RPM is the total revenue divided by the number of all website views.
RPM gives a good idea of how much a website owner is making per thousand page views, but it doesn't take into account how many ads were on the page, so it's a crude tool for understanding monetization success.
Think of it this way - can a site owner increase their RPM simply by posting more ads on the page, or by posting higher paying, flashy and intrusive ads, and it feels like the job is done? For example, the website owner did just that, and the RPM went up from $ 8 to $ 10. But it is worth considering how this will affect the users of this site. Intrusive ads are more likely to cause dissatisfaction among visitors and also increase the bounce rate. It turns out that in this situation, the website owner loses potential income from pages that might otherwise have been viewed. A lower RPM can make more money, not less as you might think at first.
Increasing RPM from $ 8 to $ 10 is great. But along with this, the bounce rate increased. As for the page views per visit, in this case it also fell from 2.5 to 1.5, from 10,000 sessions the number of page views fell from 25,000 to 15,000. Let's count: 15,000 page views at 10 USD rpm, it turns out -150 dollars.
But if the RPM were low, there would be more page views at $ 8 (and less intrusive ads). 25,000 page views out of 10,000 visits at 8 rpm is $ 200 in total revenue.
Why EPMV?
There really should be a metric that takes into account all the factors that affect income - something that tells the site owner about the income he actually gets from visitors, profit as a business. This indicator is EPMV.
EPMV automatically takes into account the impact of ads on bounce rate and pageviews per visit. If the bounce rates increase, or pv / v, then this is necessarily reflected in the EPMV.
Daily Traffic doesn't tell the whole story either.
Whether or not a site owner uses Ezoic, they need to track their EPMV to accommodate seasonal changes in traffic to the site. He needs to know how well the site is monetizing, regardless of whether the site has had a high traffic day.
For example, there is a site where:
- $ 500 on Sunday out of 100,000 visits;
- Looking at the previous Sunday, the site owner earned $ 380 with 60,000 visits.
And it seems at first glance that it is better to earn 500 dollars than 380. But in fact, this is not entirely true.
So which Sunday of the two was the best in terms of income? EPMV informs the site owner of the following:
- Last Sunday there was $ 500 / (100,000 / 1,000) = $ 5 EPMV.
- The previous Sunday was $ 380 / (60,000 / 1,000) = $ 6.33 EPMV.
- It turns out that despite the $ 500 earned last Sunday, EPMV shows the site owner that the previous Sunday was better monetized. It turns out that the previous Sunday, the site owner made more money because it was better monetized with fewer visits.
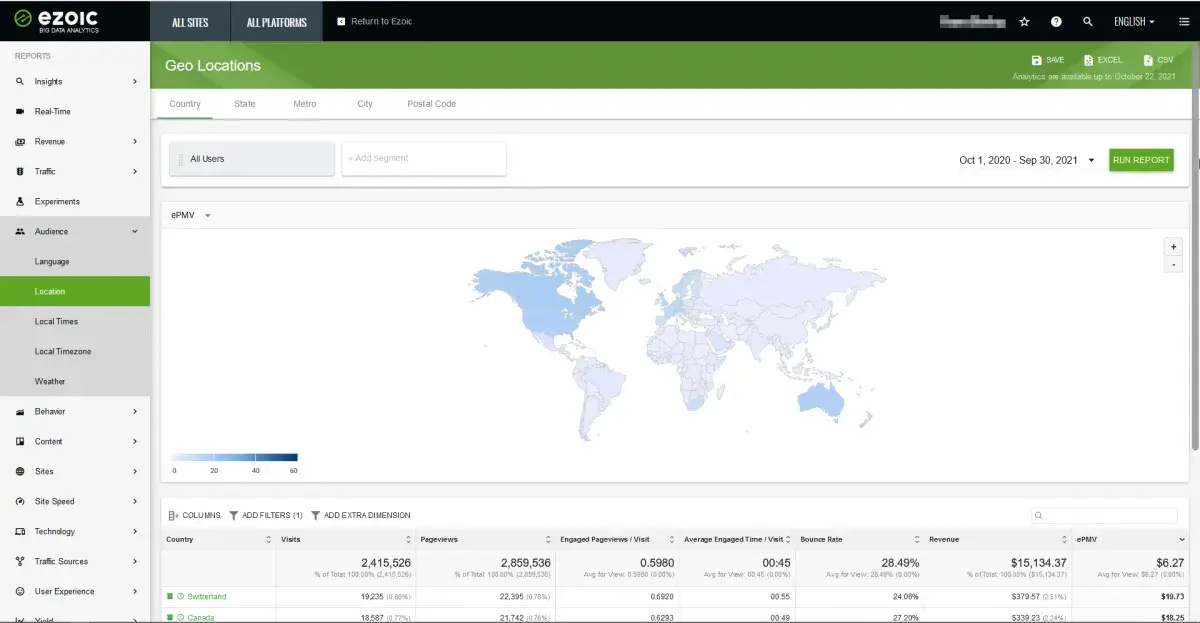
Big data analytics and statistics by country

Ezoic Big Data Analytics allows you to see everything from infrastructure to audience affects bottom line. Through this product, you can actually see how changes, content, and investments are affecting ranking and audience behavior.
In the personal account of Ezoic in the side menu there is a tab Audience, clicking on which you can see additional options, among which there is the option Location. This option allows you to view EPMV geolocation for different countries. This article provides statistics from October 1, 2020 to September 30, 2021. The data are presented in the form of a table for the following parameters:
- The name of the country;
- Attendance: 2,415,526% of the total 100% (2,415,526);
- Pageviews: 2,859,536% of total 100.00% (2,859,536)
- Pageviews / visits involved: 00:45; average value for viewing: 00:45 (0.00%);
- Average working / visiting time: 0.5980; average value for viewing: 0.5980 (0.00%);
- Bounce rate: 28.49% average value for viewing: 28.49% (0.00%);
- Income: $ 15,134.37 of the total 100% ($ 15,134.37);
- EPMV: $ 6.27; average per view $ 6.27 (0.00%).
At the beginning of the article, it was already said that EPMV is profit per visitor number. It is not always important to look at the final amount of income; according to analytical data, it is better to pay attention to the number of visits and the amount of EPMV.
Average online ads earnings by country: interactive map
For example, we will take several countries from the analytical table from Ezoic and consider them in more detail. More than two million page views analyzed in one year, taking into account all seasonality (Black Friday, Christmas and various other holidays).
USA average display advertisement EPMV
The table for this country contains the following data:
- Attendance: 156,802
- Page Views: 175,448
- Pageviews / visits involved: 0.4728;
- Average working / visiting time: 0:34;
- Bounce rate: 44.67%
- Income: $ 2,557.53;
- EPMV: $ 16.31.
Now let's analyze the data obtained from the table from Ezoic. As for the attendance, we can conclude that it is quite large. The traffic parameter depends on the number of site visitors who came to it from different sources.
The page view rate is closely related to attendance, it shows how many times a particular page was loaded on a website when a visitor navigates to it. For this country, these indicators are also good.
Engagement affects reach and impressions, and also estimates the likelihood of targeted actions (purchases, applications, confirmation of registration) on the advertised site. If we compare this indicator with the indicators of the other two countries cited, then it is quite low. To improve it, it is necessary first of all to improve the quality of the content offered to users.
Average work / visit time is the average amount of time that users spend on a page. This parameter shows how interested visitors are in studying published content, and it is also closely related to the engagement parameter. For this country, this indicator is quite low.
The bounce rate is the percentage of visitors who, after entering the page, do not take any action (do not go to another page, do not leave comments, do not add an item to the cart, in general, do not take any action). For this country, this figure is very overestimated. This means that you can try first of all to reduce the amount of intrusive ads, and in this case there will be more page views, and, accordingly, more income.
EPMV, that is, the profit per number of visitors in a given country is $ 16.31, and this figure could be higher if there was a lower bounce rate.
Average online ads earnings by US State: interactive map
Germany average display advertisement EPMV
The table for this country contains the following data:
- Attendance: 167,551
- Page views: 195,026;
- Pageviews / visits involved: 0.6804;
- Average working / visiting time: 0:55;
- Bounce rate: 28.54%
- Income: $ 2,234.12;
- EPMV: $ 13.33.
Now let's analyze the data obtained from the table from Ezoic. With regard to traffic, we can conclude that, just like in America, this indicator is quite high, as well as the indicator for page views.
Engagement affects reach and impressions, and also estimates the likelihood of targeted actions (purchases, applications, confirmation of registration) on the advertised site. If we compare this indicator with two indicators of other countries, then in this three Germany has the best indicator.
Average work / visit time is the average amount of time that users spend on a page. This parameter shows how interested visitors are in studying published content, and it is also closely related to the engagement parameter. For a given country, this is also the best indicator among the countries given, which means that, on average, users are satisfied with the content they see on websites.
The bounce rate is the percentage of visitors who, after entering the page, do not take any action (do not go to another page, do not leave comments, do not add an item to the cart, in general, do not take any action). For Germany, this parameter is an average of three countries, which means that when visitors visit websites, something is missing in order to go full circle and take any action.
EPMV, that is, the profit per number of visitors in a given country is $ 13.33.
Russia average display advertisement EPMV
The table for this country contains the following data:
- Attendance: 65,732
- Page views: 75,004;
- Pageviews / visits involved: 0.5594;
- Average working / visiting time: 0:43;
- Bounce rate: 26.72%
- Income: $ 147.56;
- EPMV: $ 2.24.
Now let's analyze the data obtained from the table from Ezoic. As for the attendance, we can conclude that it is much lower in Russia than in the countries cited for analytics. The views are also several times lower.
Engagement affects reach and impressions, and also estimates the likelihood of targeted actions (purchases, applications, confirmation of registration) on the advertised site. If we compare this indicator with the indicators of the other two countries, then here it is in second place in popularity. The average visit time is also in second place, which means that overall, users are almost satisfied with the content of the websites.
With regard to the failure rate, it is only 26.72%, which is significantly lower than the indicators in the other indicated countries. EPMV is $ 2.24, which is the lowest figure given in this analytics.
To answer the question of which country to set up for targeting, you need to pay attention to the table with statistics.
Top 10 Countries with the Most Traffic
- USA
- Germany
- France
- Poland
- Italy
- Japan
- Brazil
- Greece
- Thailand
- Russia
Top 10 countries by page views
- Germany
- USA
- Poland
- Brazil
- India
- Italy
- Thailand
- Japan
- Russia
- Turkey
Top 10 countries in terms of pageview engagement
- Turkmenistan
- Liechtenstein
- Egypt
- New Caledonia
- Madagascar
- Thailand
- Cuba
- Congo
- Peru
- Chile
Top 10 countries by average time of page visits
- Turkmenistan – 01:43
- Guinea – 01:38
- Cuba – 01:25
- Benin – 01:24
- Niger – 01:22
- Liechtenstein – 01:16
- Togo – 01:16
- Madagascar – 01:16
- Somalia – 01:15
- Kenya – 01:14
- Jordan – 01:14
Top 10 countries with the highest bounce rate
- China – 48.16%
- United States – 44.67%
- Cambodia – 38.54%
- South Korea – 36.84%
- Ireland – 36.56%
- Czech – 35.34%
- Taiwan – 34.96%
- Georgia – 34.17%
- Latvia – 34.09%
- Finland – 33.84%
Top 10 countries for the largest EPMV
- Switzerland - $19.73 EPMV
- Canada - $18.25 EPMV
- Australia - $16.31 EPMV
- USA - $16.31 EPMV
- New Zealand - $14.91 EPMV
- United Kingdom - $14.24 EPMV
- Lichtenstein - $14.18 EPMV
- Germany - $13.33 EPMV
- Belgium - $12.57 EPMV
- France - $12.09 EPMV
Top 10 Countries by Least EPMV
- Cuba - $0.03 EPMV
- Iran - $0.04 EPMV
- Syria - $0.21 EPMV
- Afghanistan - $0.31 EPMV
- Uzbekistan - $0.38 EPMV
- Albania - $0.45 EPMV
- Nepal - $0.50 EPMV
- Mongolia - $0.53 EPMV
- Venezuela - $0.54 EPMV
- Yemen - $0.56 EPMV
Big data analytics from Ezoic
With the help of Ezoic Big Data Analytics, you can increase your revenue and improve your SEO and many other metrics. The income generated can be linked to literally any criterion, for example, income from the number of words or categories.
Also, thanks to this product, you can get transparent reporting on advertising: find out how income changes depending on the size of advertising, partners and some other factors.
Income reporting can be obtained in real time, that is, literally every minute you can see how much money the site is currently generating. It is also possible to analyze income by authors, topics and many other criteria. This allows you to find out what attributes and qualities the highest paying content has.
In addition, you can find out which types of visitors are most interested and generate the most ad revenue.
With the help of Ezoic Big Data Analytics, you can connect Google rankings to site data. This will help you to see how ranking positions, CTR and seasonality affect revenue and the number of visits.
You can also find out what the audience likes the most. You can find out if your audience appreciates investments in new formats, a faster site, or changes in layout. In addition, you can understand how much visitors are viewing articles and find out at what points they have the worst experience.
This analytics can be obtained by any site owner for free, simply by registering in the Big Data Analytics system from Ezoic.
Interactive table of average EPMV by country
Frequently Asked Questions
- Does view site from different country affect the income?
- Yes, since EPMV is your profit for the number of visitors. It is not always important to look at the final amount of income, according to analytical data, it is better to pay attention to the number of visits and the amount of EPMV. And the image above shows that EPMV in each country may differ significantly.
- What is the best way to track EPMV?
- EzoicAds Big Data Analytics helps you track EPMV and other important metrics. For the best performance of the site and increase in income, it is important to pay attention to the number of visits and the amount of EPMV.
- How can I find out the indicators of Ezoic Location on the site?
- In the Ezoic personal account, there is an Audience tab in the side menu, by clicking on which you can see additional options, among which there is the Location option. This option allows you to view EPMV geolocation for different countries.
- How can publishers analyze EPMV (Earnings Per Thousand Visitors) based on different countries, and which countries typically have the highest EPMV?
- Publishers can use analytics tools like Google Analytics or ad network reporting features to segment EPMV data by country. Typically, countries with higher purchasing power like the US, UK, Canada, and Australia have higher EPMVs due to more valuable ad impressions.