How To View EPMV Per Website Articles Category / Subject?

A thematic site usually provides information on a specific topic. Sites of this type can be quite large and cover any issue in detail, providing Internet users interested in a particular topic with the opportunity to get good and detailed information on it. They are among the most popular on the internet when it comes to getting information on a wide variety of topics.
Big data analytics and statistics by content category / subject

The theme of the website should be consistent and include similar categories. This will provide an opportunity for the emergence of a target audience that will really be interested in the resource. It is also very important to fill the site with quality content, unique. To do this, you need to write unique articles yourself or buy them from copywriters.
But if you already have your own thematic site with categories, then another interest appears - to find out statistics for different categories. And this can be done with the help of a product from Ezoic - Big Data Analytics. To know detailed statistical information, you need to follow these steps:
- Log in to your Ezoic account;
- In the left side menu, select the Content parameter;
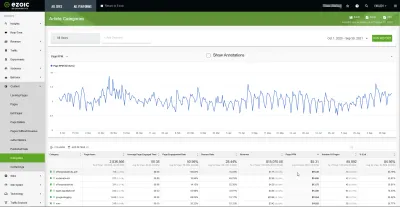
- Find the Categories button in the drop-down list and click on it.
Thus, the user will see a graph by dates in front of his eyes, and below it will be a table with a detailed examination of the data presented. What can you see in it?
- Categories;
- Page views;
- Average page load time;
- Page engagement rate;
- Bounce rate;
- Earnings per category;
- Revenue Per Mille (RPM);
- Number of pages;
- Exit percentage.
Graph and data table overview
Once in this menu, the site owner sees analytical information on his own site. Let's consider what it can be, with a specific example.
Office productivity – PDF
This is about office productivity. Let's take a closer look. The pageviews for this category are 113, which is 0.00% of the total pageviews. The average page load time is 00:38, which is equal to the average for the metric.
The page engagement rate for this category is 56.64%, which is higher than the table average, so it's pretty good. The bounce rate is average at 34.83%. The income for this category for the period indicated in the table was $ 1.75, which is 0.01% of the total income.
Page revolutions per minute, or RPM, for this category has a value of $ 15.49, with an average of $ 5.31. This result is the best in this table.
The number of pages posted on the site on this topic is 13, of the total number of posted pages, this was 0.02 percent. The yield rate is 83.19%, which is slightly lower than the average for this parameter.
Social networks
This is about social media. Let's take a closer look. Page views for this category are 211, of the total page views, this was 0.01 percent. The average page load time is 00:09, although the average for this indicator is 00:38.
The page engagement rate for this category is 18.96%, while the average is 50.56%. The bounce rate is quite high - 69.79%, while the average value for this information is only 28.44%. Income for this category was $ 2.96, of the total earned it is 0.02 percent.
The turnover of pages per minute, or RPM, for this category has a value of $ 14.05, which is much higher than the average for the table.
The number of pages posted on the site on this topic is 42, of the total number of posted pages, this was 0.05 percent. The exit rate is 52.61%, which is lower than the average.
Office productivity
This is about office productivity. Let's take a closer look. Page views for this category are 311, of the total page views this was 0.01 percent. The average page load time is 00:06, which is even less than in the previous case.
The page engagement rate for this category is 14.15%, well below the average. The bounce rate, as in the previous case, is quite high - 52.38%. Income for this category was $ 4.28, of the total earned amount is 0.03 percent.
The turnover of pages per minute, or RPM, for this category is $ 13.75, which is quite good, since it is significantly higher than the average for the table and other categories.
The number of pages posted on the site on this topic is 45, of the total number of posted pages, this was 0.05 percent. The exit rate is 38.91%, which is below average and quite good.
Apple - Apple iPhone7
Let's take a closer look. Page views for this category are 343, of the total page views, this was 0.01 percent. The average page load time is 00:33, which is very close to the average.
The page engagement rate for this category is 55.98%, which is even higher than the average. The bounce rate is slightly above average at 33.07%. Income for this category was $ 4.66, which is 0.03 percent of the total earned.
The turnover of pages per minute, or RPM, for this category has a value of $ 13.60, which, as in the rest of the cases shown in the table, is above the average.
The number of pages posted on the site on this topic is 64, of the total number of posted pages, this was 0.07 percent. The exit rate is 78.43%, which is below the overall average for this information from the table and graph.
Google - blogging
This is about blogging on Google. Let's take a closer look. The pageviews for this category are 1635, of the total pageviews this was 0.06%. Average page load time is 00:55, which is above average and better than any other category presented.
The page engagement rate for this category is 69.05%, which is also the best metric in the table. The bounce rate is very low, only 18%, which is the best result in the table. Income for this category was $ 20.66, of the total earned amount is 0.14 percent.
The turnover of pages per minute, or RPM, for this category has a value of $ 12.64, which, as in the rest of the cases shown in the table, is above the average.
The number of pages posted on the site on this topic is 59, of the total number of posted pages, this was 0.07 percent. The exit rate is 85.02%, which is slightly above the average.
Web
This is about the network. Let's take a closer look. Page views for this category are 310, of the total page views, this was 0.01 percent. The average page load time is 00:10, and this is not the worst indicator in the table.
The page engagement rate for this category is 20.32%, which is also almost the worst of the options presented. The bounce rate is 53.33%, the data is above average, but not the worst in the table and other categories. Income for this category was $ 3.42, of the total earned amount is 0.02 percent.
The number of pages per minute, or RPM, for this category is $ 11.02, which is a good indicator, since the average is $ 5.31.
The number of pages posted on the site on this topic is 58, of the total number of posted pages, this was 0.07 percent. The exit rate is 36.77%.
If you need to get similar analytical information, you can do this in your personal account from Ezoic, since this article provides information for a specific site as an example.
In fact, at first it is best to think about how to increase visits, without this indicator and without users there will be no other statistics.
Big data analytics from Ezoic
Ezoic Big Data Analytics are large structured data sets. They are processed using special automated tools to be used for statistics, analysis, forecasts and decision making. To work with Ezoic Big Data, advanced methods of integration and management are used, as well as data preparation for analytics.
Big data analytics is a relatively young product from Ezoic, but this product is especially popular for its huge functionality.
With the help of a personal account, and the data that are placed in it, you can find out literally any information, even at what time of day the site brings more income per visitor or how the weather affects it at a certain point in time. The product machine analyzes all this and displays it in the form of graphs or diagrams, as well as a detailed table with a decoding of the displayed data.
However, obtaining all this detailed analytical information for your personal website is only possible after registering with the Ezoic system.
Frequently Asked Questions
- How to view statistics about a thematic site?
- You can view statistics about the thematic site in your EzoicAds account. You need to select the Content option and go to Categories. There you can find all the important data.
- How does Ezoic Big Data Analytics work?
- Ezoic Big Data Analytics are large structured datasets. They are processed using special automated tools that are used for statistics, analysis, forecasts and decision making. To work with Ezoic Big Data, advanced methods of integration and management are used, as well as data preparation for analytics.
- How can publishers analyze and view the EPMV for different article categories or subjects on their website?
- Publishers can use web analytics tools to segment EPMV data by article category or subject. This typically involves setting up custom tracking for each category in the analytics tool and analyzing the ad revenue generated against visitor metrics for these specific sections.