EPMV of the percentage of page content viewed by visitors
- EPMV by Page viewed percentage: Learn How page view proportion Affects EPMV by Page
- Where to start improving your user experience?
- Five levels of user experience design
- 1. Strategy level:
- 2. The level of feature set.
- 3. The level of structure.
- 4. Layout level.
- 5. Surface level.
- Chart and table overview
- 0 - 10 percent
- 25 - 50 percent
- 50 - 90 percent
- 10 - 25 percent
- 90 - 100 percent
- Big data analytics from Ezoic
- Frequently Asked Questions
User experience is how visitors perceive a product, and it doesn't matter if it is a website, an application, a smartphone, or any other physical object that the user uses. What emotions a particular product evokes - joy or negative, satisfaction that the product fully meets expectations or annoys the user because it looks different or does not work at all. In other words, user experience is the impressions and emotions obtained as a result of using a particular product.
EPMV by Page viewed percentage: Learn How page view proportion Affects EPMV by Page

A page view is considered to be loading in the browser. Views is a parameter that indicates the total number of downloaded pages. Accordingly, the control and analysis of the content percentage of page views directly affects the EPMV by page.
The user experience is at least based on the concept of aesthetics. If the site is convenient for the user, then it will not be difficult to find what the user needs on it. But a site that is just easy to use can be boring at the same time. This means that the usability is excellent, but the user experience needs to be improved.
Why is improving user experience so important for SEO?The purpose of search engines is to provide users with the best results for their search queries. And the best result means not only the answer to the user's question, but also how competently the answer is. Even a high-quality and interesting article can be ignored by the search engine due to the fact that the site on which it is posted is too slow, confusing and unsafe.
Different search engines define the usability of a website in different ways. Search engines pay attention to parameters such as site loading speed, mobile optimization, content structure, as well as external and internal links of site pages.
In addition to this, search engines use custom signals to find out how visitors are reacting to a web resource. One of the important user factors is the time spent on a site page and how often visitors return to the site. If these indicators are high, then visitors find this site attractive and useful. It's important for search engines to understand how people interact with a website, which means that user experience has a significant impact on rankings.
Where to start improving your user experience?
You need to start improving the user experience by defining the purpose of the site and specific pages. What actions does the site owner expect from visitors - placing an order, registering or reading an article. Further improvements are very closely related to the goal that the site owner is trying to achieve with his help. At a minimum, the design and content should be consistent with this goal. And this same clear goal will help to determine the priorities for improving the web resource.
The best way to improve the user experience on a website is to look at it through the eyes of the user. To do this, you can ask yourself the following questions and honestly answer them:
- “What do you expect to find on the page?”;
- “Does the page design match its main purpose?”;
- “Are the necessary buttons used on the site and are they placed correctly?”;
- “Is your content structured and easy to find?”;
- Is your site displayed correctly on mobile devices?
Another way to avoid blind spots on your site is to ask people to rate it. Your target group needs to test your site and let you know if it met their expectations. You can also use questionnaires on your site, wondering whether the user has found the information they need on your site, but this should be done as unobtrusively as possible, otherwise it may backfire.
Five levels of user experience design
User experience design starts at the lowest level - defining and building a strategy.
1. Strategy level:
this is the most abstract level at which the formation and concretization of an idea takes place. At this level, the developer must find solutions that precisely define the desires, expectations and satisfy the needs of the user and customer.
The result of this level is a list of possibilities for a future project.
To accurately define the strategy, the developer needs to answer the following questions:
- who will use the product;
- how the user will use the product;
- for what purpose the person will use the product.
Answering these questions requires a thorough research of users - identifying the target audience of the product, determining the basic needs, needs, interests of the target audience, as well as the main characteristics (age, social status, demography, level of knowledge).
Establishing the user identity - the study of the main characteristics of the user will allow you to create simple scenarios of interaction with the product, system, as well as find solutions to possible problems that a typical user may encounter at one of the stages of interaction with the product. At this stage, it is not recommended to pay attention to the detail of the scenario. On the contrary, you need to focus as much as possible on all possible scenarios: “came - saw - studied”; “Came - saw - studied - called / downloaded / bought / subscribed”, etc.
2. The level of feature set.
This level is a list of the project's functionality, that is, functions-tools for the user to achieve the set goal. The result of this stage is a list of functions implemented on the site.
3. The level of structure.
This level describes the relative position of page elements and system elements as a whole. At this level, the developer clearly defines from where, where and how the user can get. A good structure makes navigation easier and more intuitive. The result of this level is the navigation function of the site - in other words, a navigation solution.
4. Layout level.
At this level, a simplified structural layout is formed based on the results of each previous level. At this level, the developer determines the most efficient layout of the user interface elements. The result is page layouts with optimal placement of functions and elements.
5. Surface level.
This level offers the final schematic view of the product for the user, including all pages, tabs, links, texts, graphics, buttons and other functional and significant elements. The result is a ready-made project mock-up that perfectly visualizes the idea for presentation to investors, customers, as well as for testing in focus groups.
There are three components to a successful project:
- Desirability - compliance with the interests and needs of the target audience, the relevance of the project;
- Viability - competitive advantages, usefulness, relevance;
- Feasibility is the reality of bringing an idea to life.
In order to find out the percentage of page content viewed by visitors, the website owner should follow these steps:
- Log in to your Ezoic account;
- Select the User Experience option in the left side menu;
- In the drop-down menu, click the Percentage of viewed content button.
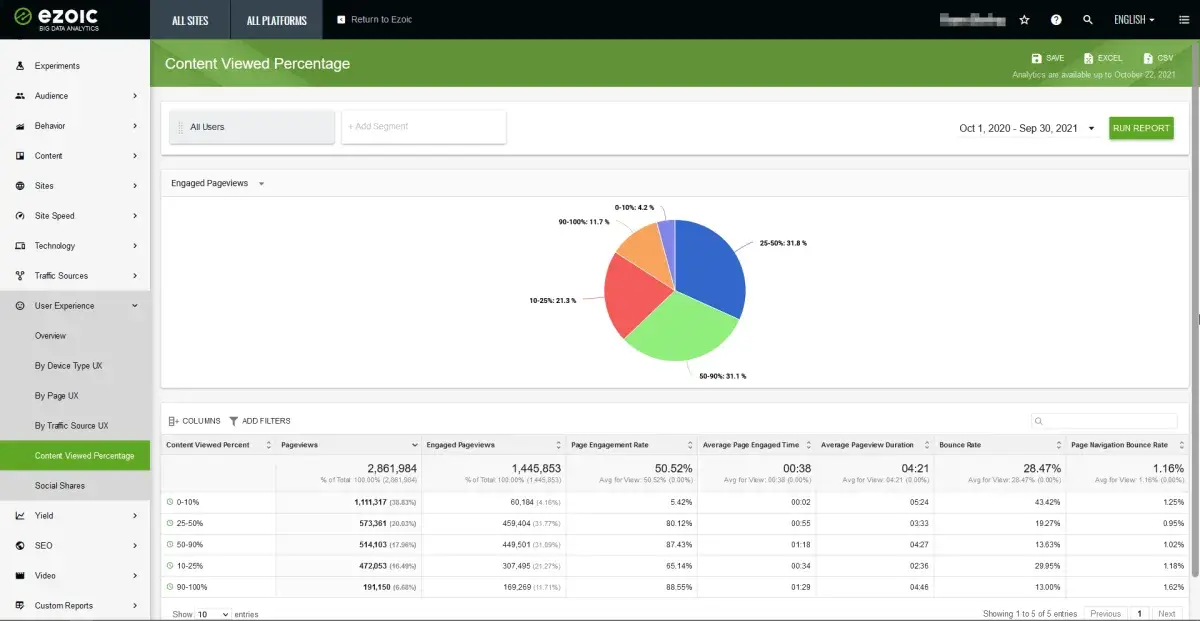
Once on the right page. The website owner will see a fairly simple diagram, and below it is a table in which the data is organized and more complete.
Chart and table overview
By opening the Percentage of Content Viewed, the website owner will see a chart, and below it - a table with more complete information on the desired category. What exactly is the information in the table?
- Percentage of content viewed;
- Page views;
- Engaged page views;
- Page engagement rate;
- Average time of interaction with the page;
- Bounce rate;
- Bounce rate when navigating pages.
It should be noted right away that the data that will be given in this article is valid only for one specific site. If you need to find out detailed analytical information about your website, then for this you need to register in the Ezoic system.
0 - 10 percent
The page views are 1,111,317, which is 38.83% of the total page views. Engaged page views 60,184, which is 4.16% of the total engagement rate.
The page engagement rate for this group is only 5.42%, which is very low as the average for this characteristic is 50.52 percent. The average time of interaction with the page is 00:02, which is also very short, since the average value in the table is 00:38. The average pageview time is 05:24, which is already better, since the average value for the table for this parameter is 04:21.
The bounce rate for this group is very high at 43.42 percent, while the table average is 28.47 percent. The bounce rate for page navigation is 1.25%, which is also above the average of 1.16%.
25 - 50 percent
The page views are 573,361, which is 20.03% of the total page views. Engaged page views 459,404, which is 31.77% of the total engagement rate as a percentage.
The page engagement rate for this group is quite high - 80.12%, while the average value for the table is 50.52 percent. The average time of interaction with the page is 00:55, which is a good indicator, since the average value for the table for this parameter is 00:38. The average pageviews are 03:33, which is not very good as the average is 04:21.
The bounce rate is quite good at 19.27 percent, while the average for this item is 28.47 percent. The bounce rate when navigating pages is within normal limits - 0.95% with an average value of 1.16%.
50 - 90 percent
Page views 514,103, which is 17.96% of the total number of views as a percentage. Engaged page views 449,501, which is 31.09% of the total engagement rate as a percentage.
The page engagement rate for this group is quite high - 87.43 percent, while the average is 50.52%. The average page engagement time is 01:18, which is a great indicator since the average is 00:38. The average pageviews are 04:27, which is also a good value as the table average is 04:21.
The bounce rate is 13.63 percent, with a table average of 28.47 percent. Bounce rate for page navigation 1.02%. which is below average.
10 - 25 percent
Page views 472,053, which is 17.96% of the total number of views. Engaged page views 307,495, which is 21.27 percent of the total engagement rate.
The page engagement rate is very good at 65.14%, while the table average is 50.525. The average time of interaction with the page is 00:34, which is just slightly below the average - 00:38. The average pageview time is 02:36, which is not a very good indicator anymore, since the average is 04:21.
The bounce rate for this group is quite high - 29.95%, while the average value according to the table is 28.47%. The bounce rate for page navigation is 1.18%, which is not much higher than the average of 1.16%.
90 - 100 percent
191,150 page views, which is 6.68% of the total page views. Engaged page views 169,269, which is 11.71% of the total engagement rate.
The page engagement rate for this group is quite high - 88.55 percent, while the average is 50.52 percent. The average page engagement time is 01:29, which is a very good indicator, because the average is 00:38. The average pageview time is 04:46, which is also a good indicator, as it is slightly above the average for the table.
The bounce rate for this group is the lowest in the table at 13 percent, while the average is 28.47 percent. The bounce rate for page navigation is the highest on the list, at 1.62%, as the category average is 1.16%.
Let's take a closer look at the diagram:
- 25 - 50 percent - 31.8%;
- 50 - 90 percent - 31.1%;
- 10 - 25 percent - 21.3%;
- 90 - 100 percent - 11.7%;
- 0 - 1- percent - 4.2%.
Big data analytics from Ezoic
Big data analytics is a fairly young product from the Ezoic company. With the help of this product, any owner of a web resource will be able to obtain full analytical information on his resource in a convenient and understandable format.
The information is displayed to the owner based on the collected data set, and this can be seen through the use of charts and detailed tables.
Thanks to this product, the owner of a web resource can find out literally any information about his site, for example, how the day of the week affects profits, or it is possible to see what income the web site brings in real time.
Frequently Asked Questions
- How to define a site strategy to improve user experience?
- Choosing the right site strategy requires identifying the users of the product, the uses, and the goals for using them. Correctly addressing these issues will provide an opportunity to improve the interaction with users.
- What are the levels of user experience design?
- The user experience design consists of five levels. Such as: strategy level, feature set level, structure level, layout level, and surface level. These levels affect the quality of your site.
- How does the percentage of page content viewed by visitors correlate with EPMV, and what tools can help measure this?
- The more content a visitor views on a page, typically the higher the EPMV, as it indicates increased engagement. Tools like heatmaps and scroll-depth analysis in web analytics platforms can help publishers understand the relationship between content engagement and EPMV.