EPMV Landing Pages: How To Find The Most Profitable Visit?
Before proceeding with a detailed examination of the graph and table with data, it is worth paying attention to some concepts. How do I find EPMV landing pages?
Big data analytics and statistics by landing page

A landing page is a web page whose primary purpose is to collect contact information from a target audience. It is used to enhance the effectiveness of advertising, increase the audience. The landing page usually contains information about a product or service. Landing pages are often navigated from social media, email newsletters, and search engine advertising campaigns.
Target audience is a group of users to which some advertising activities are directed, in which advertisers are interested and / or who are interested in any information. The target audience is people who satisfy the need that your product or service solves.
EPMV landing pages are one of the many metrics that can be viewed in Ezoic thanks to the Big Data Analytics tool. With the help of this product, you can view a huge amount of various statistical information, and even find out how much your site or sites earn in real time. You can use this product from Ezoic an unlimited number of times for free, provided that the user must have a personal account on the platform.
Big Data Analytics offers a huge amount of different statistics for website owners, including landing pages. You can view this parameter in the following steps:
- Log in to your Ezoic account;
- In the left side menu, select the Contents item;
- At this point, select the sub-item Landing pages, and a diagram will open, as well as an information table.
Chart data overview
Once in this menu, the website owner will be able to see the following information:
- Landing page;
- Visits;
- Page views;
- Page views / visits;
- Pageviews / visits involved;
- Average working / visiting time;
- Bounce rate;
- EPMV;
- Income.
Consider a table with data in more detail for each of the parameters.
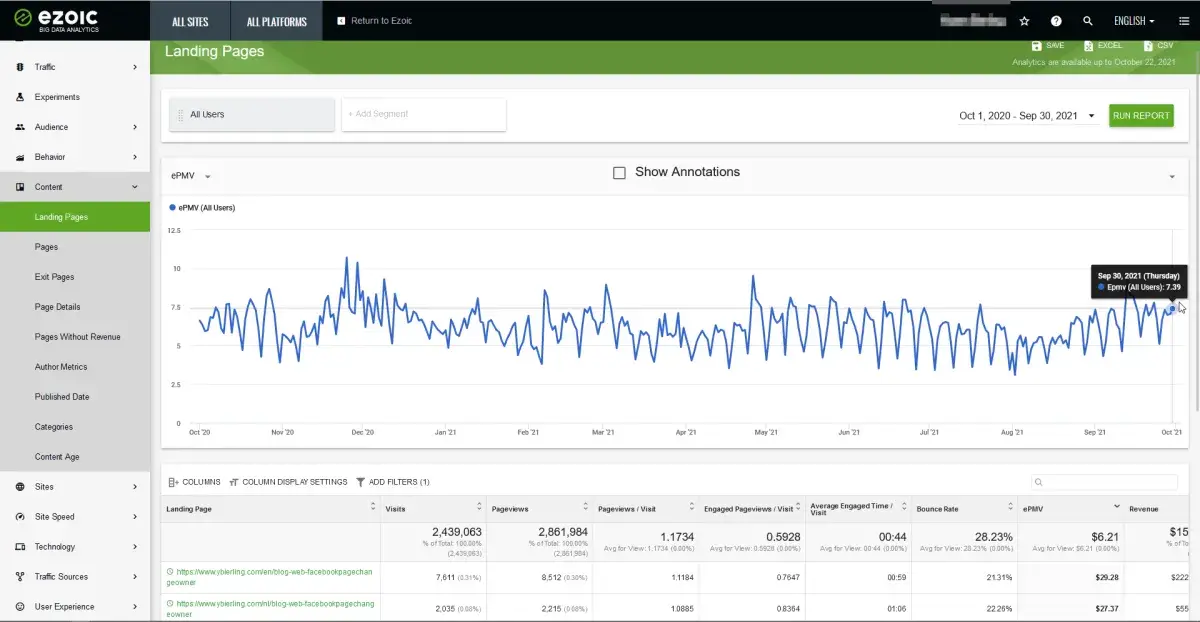
The first column in the table below the chart shows the title of the landing page. It can be either one page or several. In this case, we will look at the information using the example of two landing pages.
The second column is visits. Attendance or traffic - the number of website visitors coming from different sources: advertising, search engines, social networks, direct links. Divided into the number of unique visitors and the total number of visits. The total figure is equal to 2 million 439 thousand 063, which is one hundred percent. For the first page of the example, the visit rate is 7,611, which is 0.31 percent from one hundred percent. For the second page from the example, the visit rate is 2 thousand 035, which is 0.08% from one hundred percent. The website owner will be able to see information on this indicator for absolutely any landing page that is on his website, and with the help of this data, draw a conclusion which of these pages has had the greatest success.
The third column in the table is page views. Pageviews are the loading of a website when a visitor navigates to it. The total value of this indicator is 2 million 861 thousand 984, and this value is equal to one hundred percent. For the first landing page, this parameter is 8,512, which is 0.30%. For the second landing page - 2 thousand 215, which is 0.08%. Based on this information, we can draw a simple conclusion - the first page from our example was visited much more often than the second.
The fourth column in the table is page views / visits. The total is 1.1734, 1.1184 for the first landing page, and 1.0885 for the second.
The next column in the table is the pageviews / visits involved. The total is 0.5928, 0.7647 for the first landing page, and 0.8364 for the second.
The sixth column contains quite useful information, the average working / visiting time is displayed here. This is the average amount of time users spend on a page. This parameter shows how interested visitors are in studying published content. The overall value for this metric is 00:44. For the first landing page, the score is 00:59, for the second, it is 01:06. But it's too early to draw conclusions about this data, you need to look at the last two columns to understand which landing page generated the most profitable visits.
Consider the bounce rate. This is the percentage of visitors who, after visiting the page, do not take any action (do not go to another page, do not leave comments, do not add an item to the cart, and so on). The overall bounce rate is 28.23%. For the first landing page - 21.31%, for the second - 22.26%. But here, too, it is too early to draw conclusions, we turn to the last indicator of interest to us.
EPMV is, in simple terms, earnings per visitor. The total figure is $ 6.21. For the first landing page, EPMV is $ 29.28, for the second $ 27.37.
It turns out that despite the fact that the second landing page in our example had more visit time and visitor engagement, it brought less EPMV than the first one.
All this information is what can be used with EPMV landing pages.
Ezoic Big Data Analytics
Ezoic big data analytics is the process of analyzing large and complex data sources to identify trends, your audience's behaviors and preferences, which helps you make better business decisions for you.
The complexity of big data analytics requires new analytics tools such as predictive analytics, machine learning, streaming analytics, and techniques such as in-database and in-cluster analytics.With the help of Ezoic Big Data Analytics, you can increase your revenue and improve your SEO and many other metrics. The income generated can be linked to literally any criterion, for example, income from the number of words or categories.
Ezoic BigDataAnalytics product reviewAlso, thanks to this product, you can get transparent reporting on advertising: find out how income changes depending on the size of advertising, partners and some other factors.
Income reporting can be obtained in real time, that is, literally every minute you can see how much money the site is currently generating. It is also possible to analyze income by authors, topics and many other criteria. This allows you to find out what attributes and qualities the highest paying content has.
In addition, you can find out which types of visitors are most interested and generate the most ad revenue.
With the help of Ezoic Big Data Analytics, you can connect Google rankings to site data. This will help you to see how ranking positions, CTR and seasonality affect revenue and the number of visits.
You can also find out what the audience likes the most. You can find out if your audience appreciates investments in new formats, a faster site, or changes in layout. In addition, you can understand how much visitors are viewing articles and find out at what points they have the worst experience.
This analytics can be obtained by any site owner for free, simply by registering in the Big Data Analytics system from Ezoic.
It is worth noting that the analytical data provided in this article is only a personal example of one of the users of the Ezoic platform. For each website owner, these indicators will be individual, and this applies to all parameters. In the diagram we looked at in the article, only one metric really matters - EPMV for new visitors versus EPMV for returning visitors. It is also very important to pay attention to the fact that the EPMV for both of these indicators is approximately the same. In order for everything to work even better, it is worth focusing not so much on getting visitors to return, but on getting as many new visitors as possible every month.
Frequently Asked Questions
- How to track the EPMV landing page score?
- Thanks to EzoicAds' Big Data Analytics tool, you can track the EPMV landing page metric. You can also view a huge amount of different statistical information, and find out how much your site is earning in real time.
- What landing page data does Ezoic Big Data Analytics offer?
- Ezoic Big Data Analytics offers the following landing page data: landing page, visits, page views, page views / visits, pageviews / visits involved, average working / visiting time, bounce rate, EPMV, income.
- How can publishers identify which landing pages generate the most profitable visits in terms of EPMV?
- Publishers can utilize analytics tools to track EPMV for individual landing pages. By analyzing data like visitor duration, bounce rate, and ad interactions on these pages, publishers can identify which ones are most profitable and optimize their content strategy accordingly.