How Can You See The EPMV Of Your Slowest Pages?
- Reasons for slow loading of the site and pages
- 1.JavaScript blocking page rendering
- 2.Lack of CDN system
- 3. Excess information in the database
- 4. Incorrectly configured or not optimized CSS files
- 5. Unoptimized images
- 6. Files from external sources are not loaded
- 7. Excess advertising
- Big data analytics and statistics by page loading speed
- Graph and table overview
- First page
- Second page
- Third page
- Fourth page
- Big data analytics from Ezoic
- Frequently Asked Questions
Site loading speed is critical. For both developers and users. Nobody wants to wait 5-10 seconds for a page to load. After waiting at least a couple, the client will go to competitors, and lost visitors are lost profits. Therefore, it is so important to monitor the performance of your resource and constantly optimize the page loading speed.
Site loading speed is the time that passes from the moment a user clicks on a link to the moment when he sees a fully loaded page. This is an important factor influencing both user behavior and site ranking.Ezoic page speed is quite high and meets all the standards that guarantee the attraction of the audience and traffic.
Reasons for slow loading of the site and pages
1.JavaScript blocking page rendering
Most of the interactive sites are written in JavaScript. In the absence of proper optimization, scripts created using JS can lead to excessively slow website performance. After all, the browser will try to load the script in the first place. It determines how quickly the visitor will see the content of the page.
Fix Google PageSpeed issue Eliminate render-blocking JavaScript2.Lack of CDN system
CDN stands for Content Delivery Network. There are many servers all over the planet that host the same website. And no matter from which part of the world the visitor comes to the resource, he will receive data from the nearest server, which will have a positive effect on the download speed.
Content Delivery Olympiads: Get 31% Faster Web Page Load With The Best CDN!3. Excess information in the database
Excess is not just a large array of data, but an array of useless data. For example, WordPress plugins store an impressive amount of information in the database, and this information remains there even after the add-on is removed. The database grows and slows down, affecting the performance of the entire site.
How To Delete A Database In PHPMyAdmin?4. Incorrectly configured or not optimized CSS files
CSS, while being a markup language and not a full-fledged programming language, can negatively affect the speed of a website. It also requires some basic optimization.
Fix Google PageSpeed issue CSS in above-the-fold content5. Unoptimized images
Media content and images can be quite heavy. This wastes valuable server storage space and slows down website loading. Depending on the visitor's connection speed, the impact of heavy images on loading times can be quite noticeable.
Is Your Website Loading Slow? Start With Optimizing Images6. Files from external sources are not loaded
Problems arise when a site tries to use a file but cannot find it. If this is a conditional picture on a third-party server, then one image will simply be missing in the article. If this is a script responsible for the fundamental logic of the resource or a link to an external Framework, then the site may not load or load too slowly. In this case, it is worth rechecking all links to files stored on third-party resources and fixing the broken ones.
7. Excess advertising
An excess of banners will dramatically increase your site's load time. First of all, the problem arises at the stage when additional HTTP requests appear. It will take much longer to process each of them.
Ezoic Code: How To Integrate Optimized Ads?Big data analytics and statistics by page loading speed

In order to see analytical data on this parameter, the site owner must register or enter the Ezoic personal account. The data that will be used in this article is only valid for one specific site.
What should be done in order to see the EPMV of the slowest pages on the site?
- You must log in to your Ezoic account;
- In your personal account, in the left side menu, select Site speed;
- An additional list of options will open, and for our case you need to select Slowest Pages.
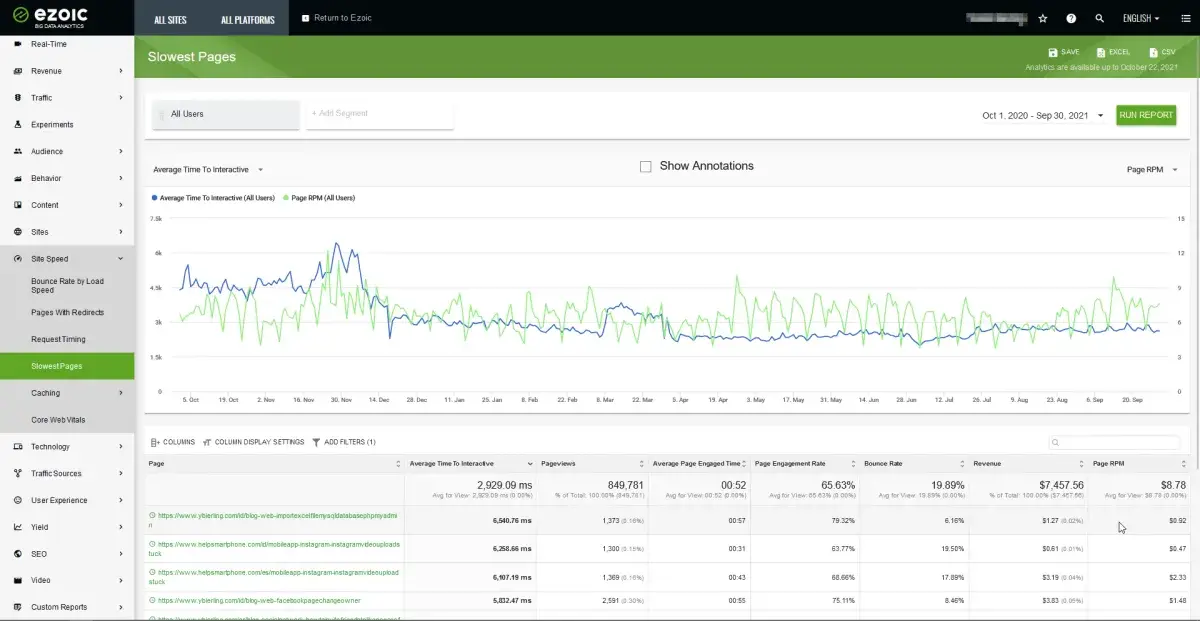
Graph and table overview
Once in this menu, the site owner will see a graph in front of him and a more detailed table below it. In the table for this case, you can see the following information:
- Page;
- Average interaction time;
- Page views;
- Average page load time;
- Page engagement rate;
- Bounce rate;
- Earnings per page loading speed;
- Pages RPM (Revenue Per Mille).
Let's take a closer look at analytics.
First page
The average interaction time for this page is 6.540 ms, while the total is 2,929.09 ms. Page views - 1,373, which is 0.16% of the total.
The average load time for this page is 00:57, which is a good indicator since the average is 00:52. The page engagement rate is 79.32%, which is also a good indicator, as the average is 65.63%.
The bounce rate is 6.16%, and according to the table, this value is on average 19.89%. The income for this page is $ 1.27, of the total income shown in the table, this is 0.02 percent.
The RPM for this page was only $ 0.92, while the average was $ 8.78.
Second page
The average interaction time for this page is 6.258 ms, while the total is 2.929.09 ms. Page views - 1,300, which is 0.15% of the total.
The average load time for this page is 00:31, which is below the average for the table. The page engagement rate is 63.77%, which is also below average.
The bounce rate is 19.50%, and according to the table, this value is on average 19.89%. The income for this page is $ 0.61, of the total income shown in the table, this is 0.01 percent.
The RPM for this page was only $ 0.47, while the average was $ 8.78.
Third page
The average interaction time for this page is 6.107 ms, while the total is 2.929.09 ms. Page views - 1,369, which is 0.16% of the total.
The average load time for this page is 00:43, which is below the average for the table. Page engagement rate of 68.66% is a good indicator as the average is 65.63%.
The bounce rate is 17.89%, according to the table, this value is on average 19.89%. The income for this page is $ 3.19, of the total income shown in the table, this is 0.04 percent.
The RPM for this page was $ 2.33, while the average was $ 8.78.
Fourth page
The average interaction time for this page is 5.832 ms, while the total is 2.929.09 ms. Pageviews - 2,591, which is 0.30% of the total, which is better than the others presented here.
The average load time for this page is 00:55, which is slightly above the average for the table. The page engagement rate is 75.11%, which is a good indicator, as the average is 65.63%.
The bounce rate is 8.46%, which is well below the average. The income for this page is $ 3.83, of the total income shown in the table, this is 0.05 percent.
The RPM for this page was $ 1.48, while the average was $ 8.78.
Big data analytics from Ezoic
Ezoic Big Data Analytics is a unique and very popular product among website owners. It contains a huge base for analytics of both the site as a whole and its individual pages and indicators.
Thanks to the use of big data analytics, you can easily get all the necessary information about traffic, income and other parameters in just a couple of clicks. Information is displayed in the form of informative graphs, colorful diagrams, as well as tables to them, containing full information on a particular criterion.
The use of this product helps to understand the site owner to pay attention to what is really important: what can be improved, and what already works great and brings good income.
Frequently Asked Questions
- How important is setting up CSS files correctly?
- Having misconfigured or unoptimized CSS files on your site can negatively impact how your site works. And this can cause slow loading of the site and pages.
- What are the reasons for the slow loading of the site and pages?
- Possible reasons for the slow loading of the site and pages that need to be improved are: JavaScript blocking page rendering, no CDN system, extra information in the database, incorrectly configured or unoptimized CSS files, unoptimized images, files from external sources not loading, or excessive advertising.
- What methods can publishers use to determine the EPMV of their slowest loading pages, and why is this important?
- Publishers can identify slow-loading pages using site speed analysis tools and then correlate this data with EPMV using their ad revenue analytics. Understanding the EPMV of slow pages is crucial as loading speed impacts user experience and consequently, ad revenue performance.