EMPV Visitor Device: Should You Focus on Mobile, Desktop, or Other?
In order to improve the performance of your website and increase your income, it is important to make sure that the site is responsive to the visitors that come to you. In analytics from Ezoic in the Big Data Analytics product, you can see that three options for the visitor's device are available for statistics: a computer, a tablet and a smartphone. Since now is literally the age of information technology, it is very difficult to decide which group of devices to adapt to, which is why this information is available in analytics.
Big data analytics and statistics by visitor device

In order to see what devices visitors are using to your website, you need to do the following:
- Log in to your Ezoic account;
- Select the Technology button in the left side menu;
- A submenu will open in which you must select the Devices option.
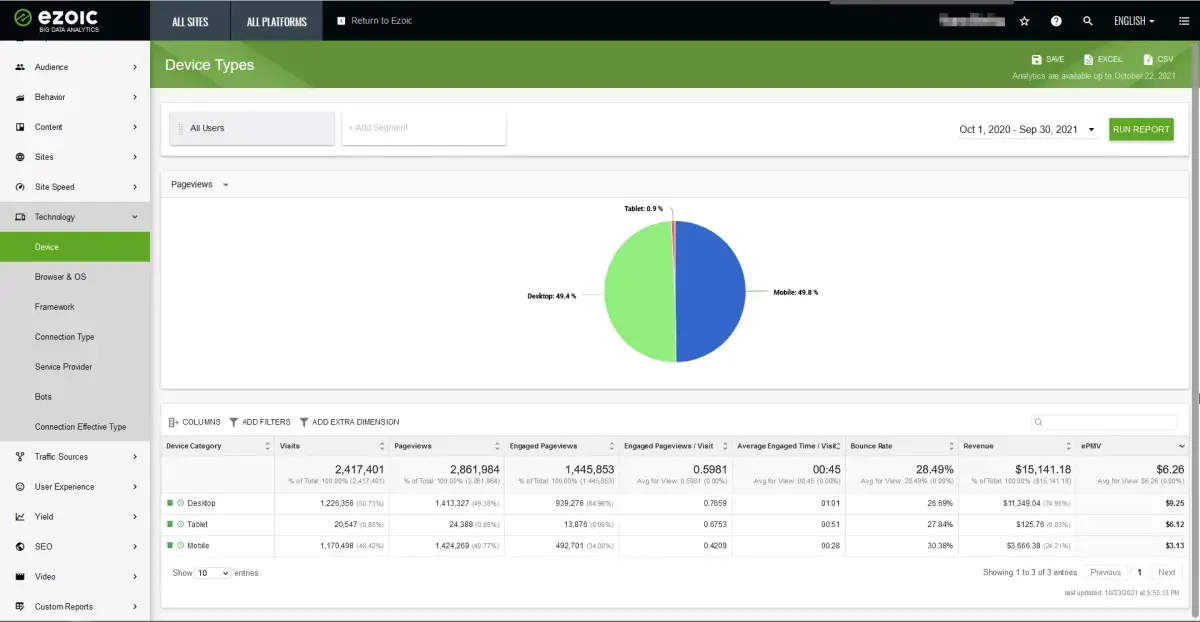
A pie chart will open in front of you, on which statistics will be displayed, as well as a table below it with a detailed decryption of the data.
It is worth noting that all numbers and statistics will be provided for a specific site, your data will be different. This article is as an example that shows what to look for when working with your own website and Big Data Analytics from Ezoic.
Chart overview
After we clicked the Devices option, we saw a colorful color chart, and below it - a table with all the statistics, and that is what we need for a more detailed overview. It includes information such as:
- Device category;
- Visits;
- Page views;
- Engaged page views;
- Pageviews / visits involved;
- Average page load time;
- Bounce rate;
- Website earnings;
- EPMV.
Let's look at detailed statistics for each device.
Desktop version of the site.
The first line refers to the desktop version of the site, that is, for any computer devices. It is this version that leads in terms of visits - 1 million 226 thousand 356 users visited the website from a computer. This amounts to 50.73% of the total number of visits. Page views - 1 million 413 thousand 327, of the total number of views, this is 49.38%. Engaged page views is one of the important indicators that makes it clear whether the content posted on the pages was interesting to users, and in the case of the desktop version of the site, this indicator is 939 thousand 276, which is 64.96% of the total indicator. Such a large percentage means that more than half of the users were happy with what they saw on this website. The average page load time in this case is 01:01. We are getting closer and closer to the most interesting in this table.
The bounce rate when using the desktop version of the site is 26.69%, which is the lowest indicator in this table. As for the income, it was $ 11,349.04, which is 74.95% of the total income.
EMPV, that is, earnings per visitor, in this case $ 9.25.
The EPMV metric is revenue per thousand visitors or session RPM, which is a metric that lets you know the total revenue from your sites. Simply put, this metric measures how much money you make for every 1,000 visitors to your entire website, not just a specific page or ad unit.Site version for tablets.
The second line in the table is reserved for data on visitors who entered the site from tablets. Just a glance at the diagram will be enough to understand that there were very few such users. But let's take a closer look. Visits in this category are 20,547, which is only 0.85% of the total number of visits. Page views are equal to 24 thousand 388, which is also 0.85% of the total number of visits. Engaged page views - 13,876, which is only 0.96% of the total. The average page load time is 00:51. The failure rate is not the highest, but still 27.84%, higher than the computer version.
Revenue is only $ 125.76 and EPMV is $ 6.12. While we are not rushing to conclusions, it remains to consider the last line in the analytical table, and then everything will become finally clear.
Site version for mobile devices.
The last row in this analytic table is for mobile visitors. This is a fairly large category of visitors. Visits are 1 million 170 thousand 498 users, which is 48.42% of the total. Page views - 1 million 424 thousand 269, which is 49.77% of the total. The parameter involved page views is 492 thousand 701, which is 34.08% of the total indicators. The average page load time is the lowest in the table - just 00:28. Moving on to the fun part.
The bounce rate is the highest in the table, at 30.38%. These users brought income in the amount of $ 3,666.38, which is 24.21% of the total income. EPMV is $ 3.13.
What conclusion can be drawn from all this received analytics? In any case, the site should be focused on all device options, although in this particular case, the desktop version of the site is in the lead in terms of total income and EPMV.
Big Data Analytics from Ezoic
With the help of Ezoic Big Data Analytics, you can increase your revenue and improve your SEO and many other metrics. The income generated can be linked to literally any criterion, for example, income from the number of words or categories.
Also, thanks to this product, you can get transparent reporting on advertising: find out how income changes depending on the size of advertising, partners and some other factors.
Income reporting can be obtained in real time, that is, literally every minute you can see how much money the site is currently generating. It is also possible to analyze income by authors, topics and many other criteria. This allows you to find out what attributes and qualities the highest paying content has.
In addition, you can find out which types of visitors are most interested and generate the most ad revenue.
With the help of Ezoic Big Data Analytics, you can connect Google rankings to site data. This will help you to see how ranking positions, CTR and seasonality affect revenue and the number of visits.
You can also find out what the audience likes the most. You can find out if your audience appreciates investments in new formats, a faster site, or changes in layout. In addition, you can understand how much visitors are viewing articles and find out at what points they have the worst experience.
This analytics can be obtained by any site owner for free, simply by registering in the Big Data Analytics system from Ezoic.
Frequently Asked Questions
- How often can I request Big Data Analytics from EzoicAds for revenue?
- EzoicAds gives you the opportunity to receive real-time income reporting, that is, literally every minute you can see how much money the site is bringing in at the moment.
- Will Ezoic's Big Data Analytics help me increase my revenue?
- With Ezoic Big Data Analytics, you can increase your revenue, improve SEO and many other metrics. The income received can be tied to literally any criterion. Also, thanks to this product, you can get transparent reporting on advertising: find out how revenue changes depending on the size of advertising, partners, and some other factors.
- In terms of EPMV, is it more profitable for publishers to focus on optimizing their sites for mobile users, desktop users, or other devices?
- The focus depends on the audience's browsing habits. Typically, mobile optimization is crucial due to the increasing prevalence of mobile browsing. However, desktop users often generate higher EPMV due to larger screen sizes and potentially longer session durations.