EPMV by Page UX: Learn How Objective UX Affects EPMV by Page
- EPMV by Page UX: Learn How Objective UX Affects EPMV by Page
- UX research and market research
- Marketing & Sales
- What a marketer should know about user experience
- Usability is not UX.
- Marketing needs UX.
- The user experience turns clients into brand advocates.
- Creating a balance between UX and internet marketing.
- What marketers should look out for
- Comprehensibility.
- Superb visual experience.
- Loyalty.
- Graph and table overview
- 1 page: Facebook page change owner (in English)
- 1 page: Facebook page change owner (in Dutch)
- 3 page: Help Smartphone – Lyca Mobile: activate Internet
- 4 page: Excel Custom AutoFilter, More Than 2 Criteria
- Big data analytics from Ezoic
- Frequently Asked Questions
UX is an experience of interaction, a term that describes the degree of satisfaction from using a product or service, interaction with a service and a company. It is a collection of the user's perception of their own feelings and various characteristics of the item of use, such as usefulness, ease of use and efficiency.
UX is the result of a series of interactions - experiences. If the experience meets the expectations and needs and is enjoyable, the user is happy. The experience of interaction is subjective, because we are talking about the individual perception of a person and his inaccurate assessment of the subject, but this experience is important for the manufacturer and the seller from the point of view of marketing. It makes it possible to change, improve the subject of use in order to better meet the needs of the market.
EPMV by Page UX: Learn How Objective UX Affects EPMV by Page

Marketing goals are to generate positive UX. To do this, a marketing specialist needs to:
- Embed UX practices into the process of creating new products, services and services;
- Assess the quality of existing products, services and services in terms of UX.
Understanding the UX allows the marketer to:
- Initiate changes and improvements to the subject of use;
- Coordinate the interaction between the user and the subject of use (9 help the user, direct, prompt);
- Assess and take into account the moments that cannot be changed in the subject of use, but you can create a new subject of use (product, service);
- Reduce negative interactions (for example, provide protection from rain when planning an outdoor event).
UX research and market research
It's worth starting with the appropriate relationship between user research, a key element of UX, and market research. Both of these practices aim to create the best design solution based on research. But what is the difference then?
Marketing research measures things like target market brand and product loyalty or target audience size. UX research identifies the wants and needs of users, which increases the outcome by improving interaction. These areas overlap when it comes to specific methods of achieving goals, such as portraits, analytics, and competitor analysis.
Indeed, through market research, a developer can get up-to-date information on audience preferences and develop a relevant app. In turn, good UX design helps the application reach the market as a real solution to customer problems.
Good design creates the basis for market research, which makes design even better over time.
Marketing & Sales
The most important aspects of UX design are those related to the target audience. This is why it's important to know what she likes and dislikes before deciding on a product design. Only through a customer-centric design will the product attract more users and increase sales conversions.
When the success of an effective marketing campaign is measured by the number of leads it generates, the user experience is the biggest driver for conversions.
What a marketer should know about user experience
When considering attracting new customers with a superior design and interface, there are a few things to keep in mind:
Usability is not UX.
Usability is part of UX and is defined by ease of use, performance, and attractiveness of the interface. However, user experience plays a much larger role and concerns the entire customer interaction with digital products.
Usability plays an important role in shaping the user experience, but if other aspects do not nudge users to the desired actions, the UX will not be optimized enough.
Marketing needs UX.
The user experience created for the target audience plays a key role in customer satisfaction and business conversions. The UX that consumers love is a good way to stay in the spotlight while staying ahead of the competition. This is why UX is so important in the marketing mix.
The user experience turns clients into brand advocates.
Great UX delights customers and can inspire them to promote the product to their loved ones. This is a real-life scenario of an app becoming popular overnight when satisfied customers start word of mouth.
Creating a balance between UX and internet marketing.
Focusing too much on business conversions often undermines the user experience and ultimately damages the product itself. On the other hand, if you consider a mobile app or website as a valuable marketing asset, and, accordingly, prioritize creating a high-quality interface, this makes the product more attractive to the market. This is why finding balance is so important.
What marketers should look out for
Every design element affects marketing results, so it's worth paying attention to whether the product meets these points:
Comprehensibility.
Marketers need to understand how and where customers find out about a product. When searching for different types of content, the audience can browse the feed, search by keywords, or ask friends. That's why design elements need to make content more searchable through the search engine, app store, and social media.
Superb visual experience.
Visual effects leave a lasting impression on the human mind and are therefore critical to user experience and marketing. Visual storytelling quickly promotes the brand and makes the interface more engaging.
Loyalty.
Building brand loyalty is a marketing priority, and good UX can help. When ease of use is combined with high performance and a pleasant interface, the user wants to come back to the site again and again. Gradually, this interaction will make him loyal.
The role of UX design and marketing interactions in market success is clear. In the current context of digital products, they work hand in hand to deliver superior user experience and profit.
While market research helps to get to know the customer in a comprehensive manner, UX research determines the most appropriate user experience ideas. Together they create experiences focused on active engagement and business transformation.
As such, marketers need to constantly communicate with designers to create a holistic view of consumer desires. Incorporating user input coupled with UX design is critical to business success.
In order for the site owner to be able to view EPMV through UX pages, he must do the following:
- Log in to your Ezoic account;
- In the left side menu, select the Contents item;
- In the drop-down menu, find the Pages button.
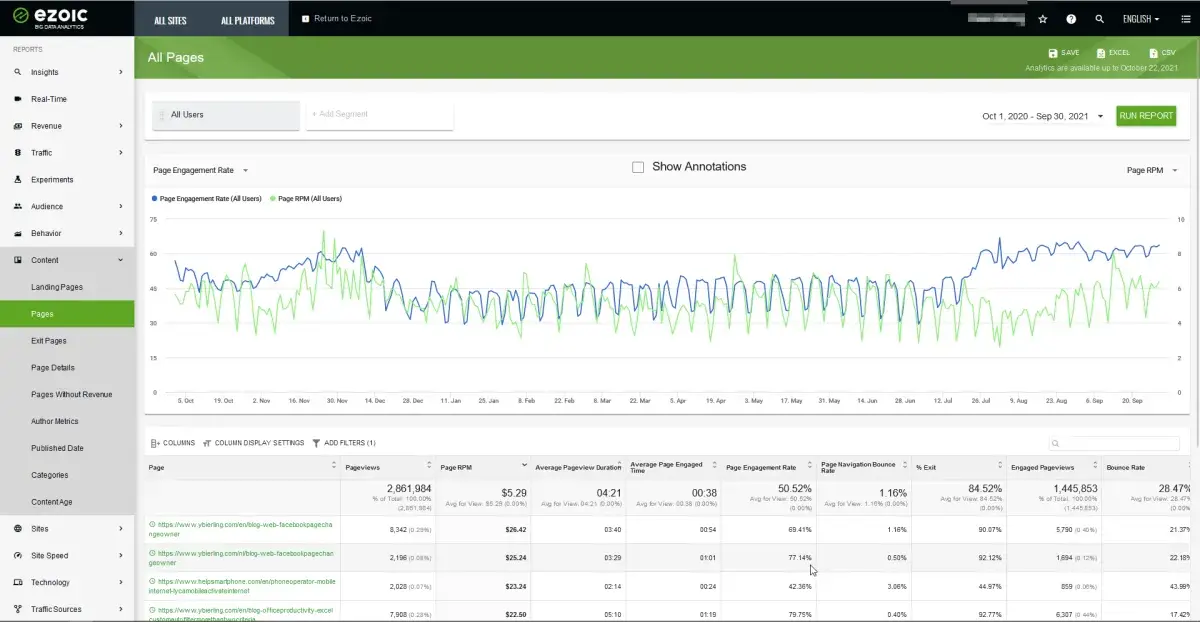
Graph and table overview
Once in this menu, the website owner will see a graph for the selected period in front of him, and below it a table in which the data will be described in more detail. What data will be in the table?
- Page;
- Page views;
- Page Revenue Per Mille (RPM);
- Average page view duration;
- Average page engaged time;
- Page engagement rate;
- Page navigation bounce rate;
- Exit percentage;
- Engaged page views;
- Bounce rate.
Consider this data in more detail.
1 page: Facebook page change owner (in English)
Pageviews are 8,342, which is 0.29% of the total pageviews as a percentage. The RPM for this page is very high - $ 26.42, while the average value for this parameter is $ 5.29.
The average viewing time for this page is 03:40, while the average for the table is 04:21. The average working / visiting time is 00:54, while the average value in the table is 00:38.
The page engagement rate was 69.41%, which is a good indicator because the average in the table is 50.52 percent. The bounce rate for page navigation is 1.16%, while the average for this parameter across the page is also 1.16%. The exit percentage is quite high for this page - 90.07%, while the average value for the table is 84.52%.
Engaged page views are 5,790, which is 0.40% of the total engagement rate as a percentage. The bounce rate for this page is 21.37%, while the average for the table is 28.47%.
1 page: Facebook page change owner (in Dutch)
Page views are equal to 2,196, which is 0.08% of the total number of views as a percentage. The RPM for this page is $ 25.24, which is a very good indicator, since the average value for the table is $ 5.29.
The average viewing time for a given page is 03:29, while the average for the table is 04:21. The average on / visit time for this page is 01:01, which is a good indicator since the average for the table is 00:38.
The page engagement rate is quite high for this page - 77.14%, while the average for the table is 50.52%. The bounce rate for page navigation is also good, at 0.50%, while the table average is 1.6%. The exit percentage in this case is even higher than in the previous one - 92.12%. while the average value in the table for this parameter is 84.52%.
Engaged page views - 1,694, which is 0.12 percent of the total engagement rate. The bounce rate is pretty good for this page, at 22.18%, while the average for the table is 28.47%.
3 page: Help Smartphone – Lyca Mobile: activate Internet
Page views are equal to 2,028, which is only 0.07 percent of the total number of views. The RPM for this page, as in the previous cases, is very good, at $ 23.24, while the average for the table is $ 5.29.
The average viewing time for this page is 02:14, and this is not a very good indicator, since the average value for the table is 04:21. The average work / visit time for this page is 00:24, which is not a very good indicator, since the average value for the table is slightly higher - 00:38.
The page engagement rate is not very good compared to other pages at 42.36%, while the table average is 50.52 percent. The bounce rate for page navigation is also not very good in this case - 3.06%, while the average for the table is 1.16%. The exit rate from this page is the best on the data presented - 44.97%, while the average value for the table is 84.52%.
Engaged page views are only 859, which is the worst result in the table, in percentage terms it is 0.06 percent. The bounce rate for this page is the highest reported at 43.99%, while the table average is 28.47%.
4 page: Excel Custom AutoFilter, More Than 2 Criteria
Page views are equal to 7,908, which is 0.28% of the total number of views as a percentage. The RPM for this page is good at $ 22.50, while the table average is $ 5.29.
The average viewing time for this page is 05:10, which is a very good indicator, since the average value for the table is only 04:21. The average time of work / visit is 01:19, while the average in the table was 00:38.
The page engagement rate is quite good at 79.75%, while the average for this table is 50.52 percent. The bounce rate for page navigation is very low, 0.40%, while the table average is 1.16%. The percentage of exit from this page is the worst of the presented in the table, and is equal to 92.77%, while the average value according to the table for this indicator is 84.52 percent.
Engaged Page Views is literally the best metric for this case across the table at 6.307, or 0.44 percent of the overall engagement rate. The bounce rate for this page is the lowest in the table according to the data presented - 17.42%, while the average for this indicator is significantly higher - 28.47%.
Big data analytics from Ezoic
Big data analytics from Ezoic is a relatively new product released so that the owners of various web resources around the world can receive up-to-date information on their sites.
In order to receive the full array of data, the website owner must register on the Ezoic platform, after which the data can be received at any time of the day.
This product is good because it collects a huge amount of data, and the information is brought to the site owner in a very simple format - in the form of tables, graphs and diagrams.
With the help of big data analytics, you can find out information such as slow pages, how much revenue a site has received in a selected period of time, how many characters should be in published articles. There is also a function thanks to which you can find out in real time how much money the site brought to its owner in a particular minute. And this is just a small part of what can be learned with this product from Ezoic.
Frequently Asked Questions
- What is your current impression of ezoic?
- Definitely the best service to increase ad revenue. On the site, you can make a so-called experimental search, which means combining impressions from several advertising products on the site, determining the most effective options in terms of user activity and increasing traffic accordingly.
- How can I watch EPMV through UX pages?
- Use your EzoicAds account to view EPMV through the UX pages. You need to select the Content item in the menu and go to the Pages tab. All the information you need will be there.
- How to create positive UX on a website?
- To create a positive UX, a marketer needs to implement UX practices in the process of creating new products and services and evaluate the quality of existing products and services in terms of UX.
- How does the user experience (UX) of a webpage objectively affect its EPMV, and how can publishers measure this impact?
- The UX of a page, including its design, navigation ease, and loading speed, significantly impacts EPMV. Better UX typically leads to higher engagement and ad interaction. Publishers can use tools like Google Analytics and user experience testing platforms to measure how UX changes affect EPMV.